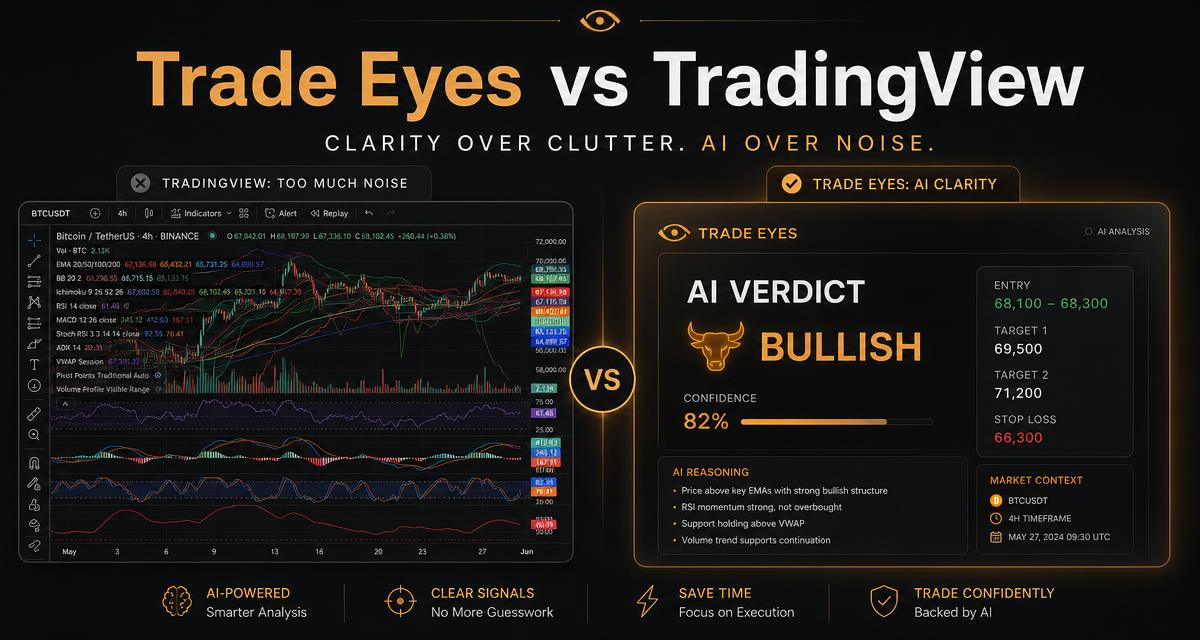
Two different jobs, not two rivals
TradingView is a charting platform: data, drawing tools, thousands of indicators, alerts, and a scripting language. Trade Eyes is a reading layer: you hand it a chart image and it returns a tactical verdict. Most serious traders end up using both — chart in TradingView, second opinion from Trade Eyes.
Where TradingView wins
- Live data across nearly every market, with depth Trade Eyes does not replicate.
- Custom indicators and Pine Script strategies you can backtest.
- Price alerts, watchlists, replay mode, and multi-chart layouts.
- A social feed of published ideas.
Where Vision AI wins
- Speed to a decision. No indicator configuration. One upload, a verdict in seconds.
- Concrete levels. Entry zone, stop loss, TP1 and TP2 with the resulting risk/reward, not a hedge.
- Pattern and structure detection. Engulfing candles, fair value gaps, order blocks, rising wedges — read from the image, not from a formula you had to add.
- Sentiment and risk framing. A risk score that flags FOMO chases and likely whale traps before you click buy.
- Consistency. The same discipline applied to every chart, including the ones you want to be bullish on.
Whale traps, liquidity, and dark pool context
Retail indicator setups are mostly lagging: RSI, MACD and EMAs describe what already happened. The structural questions — did that spike sweep obvious stops before reversing? is price sitting on an untested imbalance? — are visual. A whale trap looks like a decisive break of a well-watched high that immediately closes back inside range; that is pattern recognition, and it is precisely what a vision model is good at.
Institutional flow deserves an honest caveat: real dark pool prints are off-exchange and not visible on a retail chart. What is visible is their footprint — abnormal volume nodes, sudden absorption, and rejection wicks at levels no retail trader would defend. Trade Eyes reads those footprints; it does not claim to see the order book.
Side-by-side
| Task | TradingView | Trade Eyes |
|---|---|---|
| Live data & charting | Best in class | Not a data provider |
| Indicator setup time | Manual, per chart | None — upload and read |
| Entry / stop / target | You decide | Suggested with R/R |
| Pattern detection | Some, via scripts | Native to the model |
| FOMO / trap warning | No | Risk score |
| Backtesting | Yes, Pine Script | No |
A workflow that uses both
Chart in TradingView on the timeframe you trade. Screenshot it. Upload to Trade Eyes for an independent read. If the two agree, you have confluence; if they disagree, you have a reason to size smaller or wait. Log the outcome in the journal so you can measure which reads actually paid.
Get a second opinion on your next setup
Screenshot your TradingView chart and see what a vision model reads in it.
Frequently asked questions
Is Trade Eyes a replacement for TradingView?
No. TradingView is a charting and data platform; Trade Eyes reads a chart screenshot and returns a tactical verdict. They work well together.
Can AI chart analysis detect whale traps?
It can flag the visual footprint — a sweep of an obvious high or low followed by immediate rejection back inside range. It cannot see the order book.
Can it see dark pool trades?
No retail tool can. Off-exchange prints are not on the chart; what is readable is their footprint in volume and absorption.
Do I still need indicators?
Only if they help you. RSI, MACD and EMAs are useful context, but structure and levels drive the trade.